Showing posts with label sales. Show all posts
Showing posts with label sales. Show all posts
Wednesday, March 25, 2015
Commercial Van Sales In Canada January 2015

• Canada Vehicle Sales Rankings By Model - January 2015
 |
| Click Chart To Expand |
Leading the class in January is also not as difficult a feat as it will be in, for example, May, when last years fifth-month sales were 156% stronger than first-month sales.
The Ram Cargo Van owned less than 8% of total commercial van sales in May of last year, when it ranked sixth overall.
But the commercial van category is in a state of upheaval at the moment. As traditional leader Ford replaces its E-Series with the Transit - the best seller in America in January - and General Motors adds a Nissan NV200 copy to its fleet and FCA/Chrysler Group begins marketing the Fiat Doblo as a ProMaster City and sees its Grand Caravan/Town & Country/Cargo Van factory temporarily shut down in Windsor, its difficult to forecast the results from one month down the road, let alone five or six.
You can click any model name in the tables below to find historical monthly and yearly Canadian auto sales data. You can also select a make and model at GCBCs Sales Stats page. These tables are now sortable, so you can rank commercial vans any which way you like. Suggestions on how GCBC should break down segments can be passed on through the Contact page.
Click Column Headers To Sort • February 2015 • December 2014 • January 2014
Van | January 2015 | January 2014 | % Change | 2015 YTD | 2014 YTD | % Change |
|---|---|---|---|---|---|---|
Chevrolet Express ³ | 162 | 186 | -12.9% | 162 | 186 | -12.9% |
Chevrolet City Express ² | 50 | --- | --- | 50 | --- | --- |
Ford E-Series ³ | 109 | 349 | -57.3% | 109 | 349 | -57.3% |
Ford Transit ³ | 319 | --- | --- | 319 | --- | --- |
Ford Transit Connect ² | 202 | 60 | 237% | 202 | 60 | 237% |
GMC Savana ³ | 172 | 182 | -5.5% | 172 | 182 | -5.5% |
Mercedes-Benz Sprinter ³ | 311 | 242 | 28.5% | 311 | 242 | 28.5% |
Nissan NV ³ | 60 | 44 | 36.4% | 60 | 44 | 36.4% |
Nissan NV200 ² | 97 | 82 | 18.3% | 97 | 82 | 18.3% |
Ram Cargo Van ² | 409 | 262 | 56.1% | 409 | 262 | 56.1% |
Ram ProMaster ³ | 141 | 119 | 18.5% | 141 | 119 | 18.5% |
Ram ProMaster City ² | 46 | --- | --- | 46 | --- | --- |
--- | --- | --- | --- | --- | --- | --- |
Full-Size Commercial Vans ³ | 1162 | 936 | 24.1% | 1162 | 936 | 24.1% |
--- | --- | --- | --- | --- | --- | --- |
Small Commercial Vans ² | 916 | 590 | 55.3% | 916 | 590 | 55.3% |
--- | --- | --- | --- | --- | --- | --- |
Total | 2078 | 1526 | 36.2% | 2078 | 1526 | 36.2% |
RECOMMENDED READING
Commercial Van Sales In Canada - February 2015 YTD
Commercial Van Sales In Canada - December & 2014 Year End
Commercial Van Sales In Canada - January 2014
Canada Auto Sales Brand Rankings - January 2015
Top 13 Best-Selling Trucks In Canada - January 2015
Minivan Sales In Canada - January 2015

Monday, March 16, 2015
Midsize SUV Sales In Canada June 2014 YTD

• Canada Vehicle Sales Rankings By Model - June 2014 YTD
• Canada SUV & Crossover Sales Rankings By Model - June 2014 YTD
 |
| Click Chart To Expand |
Chevrolet Traverse sales were nearly chopped in half last month. GMC Acadia volume slid 31%. Not to mention the fact that Saturn didnt sell a single Outlook. *Gasp*
Its not as though Canadians werent buying big crossovers in June. Extract the Acadia, Enclave, and Traverse from the equation and sales in their category improved 4%.
We dont know if Canadian consumers have suddenly turned away from GM because of the companys self-inflicted recall crisis. GM wasnt the only automaker to report fewer sales in June 2014 than in June 2013 - Hyundai and Kia sales were down 6%. Nor were the trio of Lambda crossovers the only ones in their class to record losses: sales of the Honda Pilot, Jeep Grand Cherokee, and Hyundai Santa Fe XL decreased as well.
But forgetting the overall GM complex for a moment, consider the plight of dealers. They combined to sell 3700 fewer new vehicles last month than at the same time one year ago, 6876 fewer than in June 2012. True, there are fewer GM dealers competing over the companys Canadian sales than their used to be, but GM is also selling far fewer vehicles since Pontiac, Saturn, Oldsmobile, and Hummer disappeared.
GM Canada sales in 2014 will likely amount to around half the total GM achieved in 2005. Moreover, at this moment the dealers are selling fewer copies of their more profitable vehicles: these crossovers, for example, and their pickup trucks, sales of which slid 17% in June.
You can click any model name in the tables below to find historical monthly and yearly Canadian auto sales data. You can also select a make and model at GCBCs Sales Stats page. These tables are now sortable, so you can rank SUVs and crossovers any which way you like. Suggestions on how GCBC should break down segments can be passed on through the Contact page.
Click Column Headers To Sort • July 2014 • May 2014 • June 2013
SUV | June 2014 | June 2013 | % Change | 2014 YTD | 2013 YTD | % Change |
|---|---|---|---|---|---|---|
Buick Enclave | 279 | 443 | -37.0% | 1530 | 1611 | -5.0% |
Chevrolet Traverse | 259 | 498 | -48.0% | 1731 | 1732 | -0.1% |
Dodge Durango | 398 | 113 | 252% | 1916 | 1090 | 75.8% |
Ford Edge | 2607 | 2612 | -0.2% | 9098 | 9184 | -0.9% |
Ford Explorer | 1187 | 1048 | 13.3% | 5972 | 5302 | 12.6% |
Ford Flex | 542 | 426 | 27.2% | 1488 | 1547 | -3.8% |
GMC Acadia | 431 | 626 | -31.2% | 2845 | 2271 | 25.3% |
Honda Pilot | 545 | 578 | -5.7% | 2926 | 2733 | 7.1% |
Hyundai Santa Fe Sport * ^ | 1907 | 2168 | -12.0% | 14,066 | 12,703 | 10.7% |
Hyundai Santa Fe XL ^ | 329 | 385 | -14.5% | 2539 | 1008 | 152% |
Hyundai Veracruz | --- | 22 | -100% | --- | 356 | -100% |
Jeep Grand Cherokee | 1100 | 1394 | -21.1% | 5695 | 5716 | -0.4% |
Kia Sorento * | 1569 | 1895 | -17.2% | 6951 | 7433 | -6.5% |
Mazda CX-9 | 132 | 62 | 113% | 718 | 862 | -16.7% |
Nissan Murano | 419 | 283 | 48.1% | 1857 | 1936 | -4.1% |
Nissan Pathfinder | 857 | 598 | 43.3% | 4825 | 3257 | 48.1% |
Subaru Tribeca | 9 | 24 | -62.5% | 90 | 108 | -16.7% |
Toyota 4Runner | 289 | 222 | 30.2% | 1897 | 1327 | 43.0% |
Toyota Highlander | 1204 | 704 | 71.0% | 5263 | 3634 | 44.8% |
Volkswagen Touareg * | 177 | 204 | -13.2% | 998 | 1049 | -4.9% |
--- | --- | --- | --- | --- | --- | --- |
Total | 14,240 | 14,305 | -0.5% | 72,405 | 64,859 | 11.6% |
Offroaders | June 2014 | June 2013 | % Change | 2014 YTD | 2013 YTD | % Change |
|---|---|---|---|---|---|---|
Jeep Wrangler * | 2553 | 2238 | 14.1% | 11,476 | 10,161 | 12.9% |
Nissan Xterra * | 57 | 93 | -38.7% | 576 | 655 | -12.1% |
Toyota FJ Cruiser * | 62 | 60 | 3.3% | 434 | 332 | 30.7% |
--- | --- | --- | --- | --- | --- | --- |
Total | 2672 | 2391 | 11.8% | 12,486 | 11,148 | 12.0% |
Tall Wagons & Crossovers | June 2014 | June 2013 | % Change | 2014 YTD | 2013 YTD | % Change |
|---|---|---|---|---|---|---|
Honda Crosstour * | 76 | 96 | -20.8% | 412 | 617 | -33.2% |
Subaru Outback * | 534 | 522 | 2.3% | 3342 | 2976 | 12.3% |
Toyota Venza * | 711 | 819 | -13.2% | 4078 | 4696 | -13.2% |
--- | --- | --- | --- | --- | --- | --- |
Total | 1321 | 1437 | -8.1% | 7832 | 8289 | -5.5% |
* vehicle also displayed in another GCBC segment breakdown
^ Total Santa Fe volume: down 12.4% to 2236 in June; up 21.1% to 16,605 YTD.
GCBC isnt here to break down segments, an impossible task for any group, but to display sales data for the sake of comparison. The more ways sales data can be displayed, the better. This explains why youll see the Wrangler and Xterra listed with small SUVs, too, and the Subaru Outback shown with mainstream cars... because readers have wanted it both ways. You can always find the sales results for EVERY vehicle and form your own competitive sets by using the All Vehicle Rankings posts.
RECOMMENDED READING
Midsize SUV Sales In Canada - July 2014 YTD
Midsize SUV Sales In Canada - May 2014 YTD
Midsize SUV Sales In Canada - June 2013 YTD
Canada Auto Sales Brand Rankings - June 2014 YTD
Top 20 Best-Selling SUVs In America - June 2014
Small SUV Sales In Canada - June 2014 YTD
Sunday, March 15, 2015
Sporty Car Sales In America December 2014 Year End

But the Mustang, buoyed by a new generation that became available toward the end of the year, was the dominant muscle car during the latter part of 2014, outselling the Camaro in November and December by wide margins.
But December was a strong month for their segment overall, as the Mustangs 66% year-over-year improvement partnered with the Dodge Challengers 72% leap and the 32% jump in Camaro sales. Dodge needed best-ever December sales for the Challenger to record its sixth consecutive year-over-year year-end improvement in 2014, and demand for the Challenger did indeed reach that level. The trio combined for a 55% improvement last month, equal to 7463 units.
• U.S. Vehicle Sales Rankings By Model - December & 2014 Year End
• U.S. Car Sales Rankings By Model - December & 2014 Year End
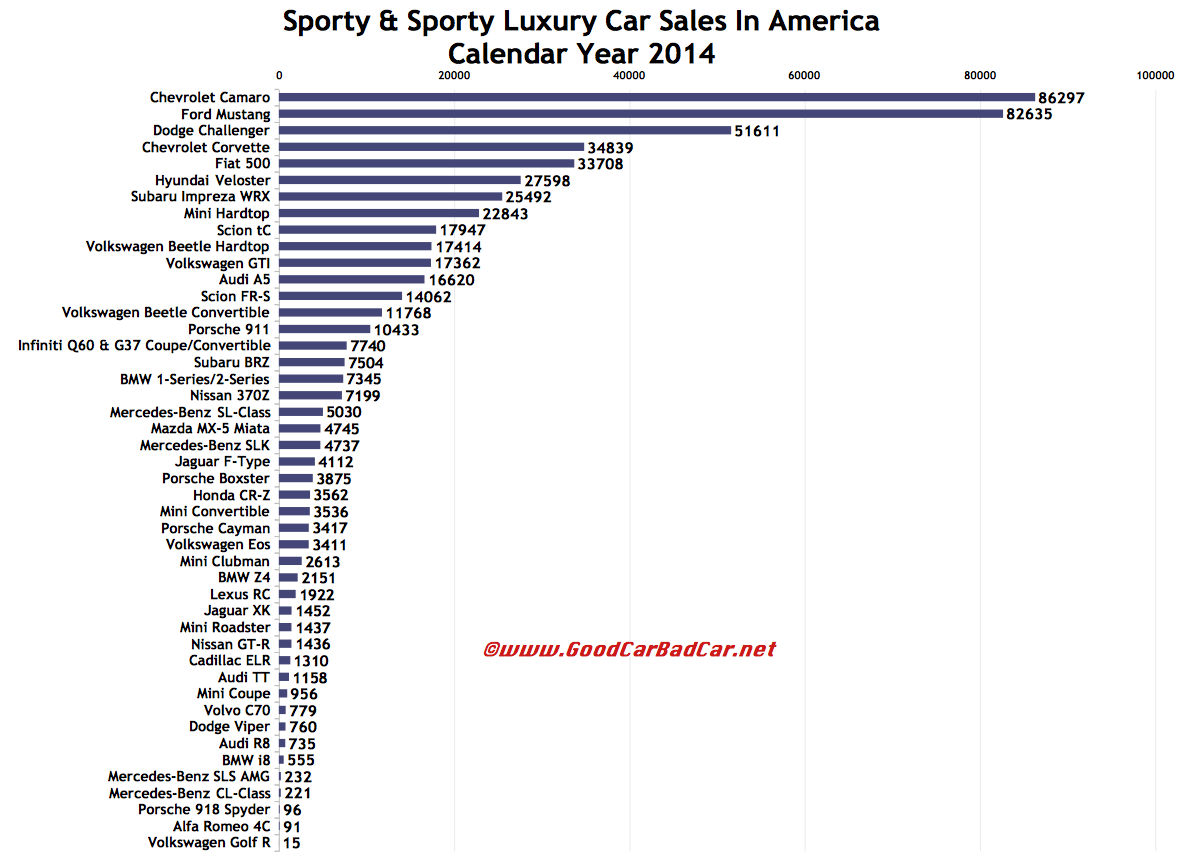
The Camaro was Americas 26th-best-selling car in calendar year 2014; the Mustang 29th; the Challenger 45th. In December, the Mustang ranked 21st; the Camaro 31st; the Challenger 42nd.
For every 11 Camaros, Mustangs, and Challengers sold in America in 2014, consumers also picked up one 4C, TT, Z4, F-Type, SLK, Boxster, or Cayman. This group of European sports cars combined for a marginal 0.2% improvement in 2014 thanks almost completely to the F-Type. Sales of the soon-to-be-replaced TT slid 44%, the Z4 was down 13%, the SLK slid slightly, and the Boxster/Cayman duo fell 8%.
 |
| Click Chart To Expand |
But 2014 was the year of the Corvette. 34,839 copies of Chevrolets iconic sports car were sold to Americans last year, the highest total since 2006, more than the number of 4Cs, TTs, Z4s, F-Types, SLKs, Boxsters, Caymans, R8s, ELRs, GT-Rs, 911s, and Vipers combined.
You can click any model name in the tables below to find historical monthly and yearly U.S. auto sales data. You can also select a make and model at GCBCs Sales Stats page. These tables are now sortable, so you can rank sports cars, coupes, and GTs any which way you like. Suggestions on how GCBC should break down segments can be passed on through the Contact page.
Click Column Headers To Sort • January 2015 • November 2014 • December 2013
American Muscle | December 2014 | December 2013 | % Change | 2014 | 2013 | % Change |
|---|---|---|---|---|---|---|
Chevrolet Camaro | 6628 | 5015 | 32.2% | 86,297 | 80,567 | 7.1% |
Dodge Challenger | 4938 | 2872 | 71.9% | 51,611 | 51,462 | 0.3% |
Ford Mustang | 9511 | 5727 | 66.1% | 82,635 | 77,186 | 7.1% |
--- | --- | --- | --- | --- | --- | --- |
Total | 21,077 | 13,614 | 54.8% | 220,543 | 209,215 | 5.4% |
Euro Sports Cars | December 2014 | December 2013 | % Change | 2014 | 2013 | % Change |
|---|---|---|---|---|---|---|
Alfa Romeo 4C | 67 | --- | --- | 91 | --- | --- |
Audi TT | 12 | 159 | -92.5% | 1158 | 2053 | -43.6% |
BMW Z4 | 168 | 191 | -12.0% | 2151 | 2480 | -13.3% |
Jaguar F-Type | 448 | 185 | 142% | 4112 | 2250 | 82.8% |
Mercedes-Benz SLK | 384 | 393 | -2.3% | 4737 | 4757 | -0.4% |
Porsche Boxster | 144 | 262 | -45.0% | 3875 | 4570 | -15.2% |
Porsche Cayman | 198 | 277 | -28.5% | 3417 | 3383 | 1.0% |
--- | --- | --- | --- | --- | --- | --- |
Total | 1421 | 1467 | -3.1% | 19,541 | 19,493 | 0.2% |
Other Sporty Cars | December 2014 | December 2013 | % Change | 2014 | 2013 | % Change |
|---|---|---|---|---|---|---|
Audi A5 | 1292 | 1384 | -6.6% | 16,620 | 18,664 | -11.0% |
BMW 1-Series & 2-Series *^ | 724 | 1039 | -30.3% | 7345 | 7220 | 1.7% |
Chevrolet Corvette | 3552 | 3005 | 18.2% | 34,839 | 17,291 | 101% |
Honda CR-Z | 224 | 384 | -41.7% | 3562 | 4550 | -21.7% |
Infiniti Q60 & G37 Coupe/Convertible * | 658 | 462 | 42.4% | 7740 | 9806 | -21.1% |
Lexus RC | 1042 | --- | --- | 1922 | --- | --- |
Mazda MX-5 Miata | 378 | 276 | 37.0% | 4745 | 5780 | -17.9% |
Mazda RX-8 | --- | --- | --- | 1 | 1 | 0.0% |
Mitsubishi Eclipse | --- | --- | --- | --- | 109 | -100% |
Nissan 370Z | 446 | 469 | -4.9% | 7199 | 6561 | 9.7% |
Scion FR-S | 834 | 1029 | -19.0% | 14,062 | 18,327 | -23.3% |
Subaru BRZ | 416 | 705 | -41.0% | 7504 | 8587 | -12.6% |
Subaru Impreza WRX * | 2816 | 1680 | 67.6% | 25,492 | 17,969 | 41.9% |
Volkswagen Eos | 204 | 222 | -8.1% | 3411 | 4178 | -18.4% |
Volkswagen GTI * | 1789 | 976 | 83.3% | 17,362 | 13,310 | 30.4% |
Volkswagen Golf R * | --- | 22 | -100% | 15 | 1598 | -99.1% |
Volvo C70 | 1 | 195 | -99.5% | 779 | 3234 | -75.9% |
--- | --- | --- | --- | --- | --- | --- |
Total | 14,376 | 11,848 | 21.3% | 152,598 | 137,185 | 11.2% |
Warm Hatches | December 2014 | December 2013 | % Change | 2014 | 2013 | % Change |
|---|---|---|---|---|---|---|
Fiat 500 * | 2302 | 2324 | -0.9% | 33,708 | 35,834 | -5.9% |
Hyundai Veloster * | 1685 | 3047 | -44.7% | 27,598 | 30,711 | -10.1% |
Mini Cooper * | 4545 | 3887 | 16.9% | 31,385 | 41,915 | -25.2% |
Scion tC * | 1128 | 1143 | -1.3% | 17,947 | 19,094 | -6.0% |
Volkswagen Beetle * | 2270 | 2819 | -19.5% | 29,182 | 43,134 | -32.3% |
--- | --- | --- | --- | --- | --- | --- |
Total | 11,930 | 13,220 | -9.8% | 139,820 | 170,688 | -18.1% |
Premium Sporty Cars | December 2014 | December 2013 | % Change | 2014 | 2013 | % Change |
|---|---|---|---|---|---|---|
Audi R8 | 64 | 70 | -8.6% | 735 | 813 | -9.6% |
BMW i8 | 158 | --- | --- | 555 | --- | --- |
Cadillac ELR | 118 | 6 | 1867% | 1310 | 6 | 217% |
Dodge Viper | 89 | 55 | 61.8% | 760 | 591 | 28.6% |
Jaguar XK | 88 | 105 | -16.2% | 1452 | 1346 | 7.9% |
Lexus LFA | 1 | 1 | 0.0% | 17 | 23 | -26.1% |
Mercedes-Benz CL-Class | 14 | 45 | -68.9% | 221 | 476 | -53.6% |
Mercedes-Benz SL-Class | 539 | 565 | -4.6% | 5030 | 7007 | -28.2% |
Mercedes-Benz SLS AMG | 6 | 44 | -86.4% | 232 | 451 | -48.6% |
Nissan GT-R | 156 | 78 | 100% | 1436 | 1236 | 16.2% |
Porsche 911 | 776 | 828 | -6.3% | 10,433 | 10,442 | -0.1% |
Porsche 918 Spyder | 39 | --- | --- | 96 | --- | --- |
--- | --- | --- | --- | --- | --- | --- |
Total | 2048 | 1797 | 14.0% | 22,277 | 22,391 | -0.5% |
* indicates a vehicle which is also shown in another GCBC segment breakdown
^ BMW USA, not GoodCarBadCar, has chosen to combine sales figures of the 1-Series and 2-Series.
Clearly GoodCarBadCar is not suggesting that the cars in the two tables above are all direct competitors. Establishing categories among cars as unique as even the Audi TT and Porsche Boxster has never pleased a single reader, so cars have been lumped together so you can simply see how buyers looking for sports cars, roadsters, hot hatches, convertibles, GTs, and wanna-be sports cars spend their money. Greater categorization of cars would only lead to problems that automakers create by not isolating model-specific sales figures: we dont know how many M3s BMW has sold or how many Civics are Si models, for example. The numbers we do have are listed above. The BMW 6-Series has been removed from the premium list because we dont use this space as a showcase for sedans (unless automakers release data for high-end sporting models like the Lexus ISF, as Toyota Canada does) and the 6-Series lineup now relies heavily on a sedan variant. GoodCarBadCar is always open to hearing about the ways you would break down segments, so feel free to get in touch. You can always find the sales results for EVERY vehicle and form your own competitive sets by using the All Vehicle Rankings posts. Sales data for brands such as Aston Martin, Ferrari, Lamborghini, Lotus, Rolls-Royce etc. are unfortunately not broken down by model. ANDC estimates say sales for those brands in 2014 were 1224, 2100, 708, 172, and 900, respectively. Tesla, unfortunately, doesnt release model-specific monthly U.S. sales data, but HybridCars.com estimates 1900 December Tesla sales, 16,550 in 2014.
RECOMMENDED READING
Sporty Car Sales In America - January 2015
Sporty Car Sales In America - November 2014 YTD
Sporty Car Sales In America - December 2013 & Year End
Top 20 Best-Selling Cars In America - December 2014
U.S. Auto Sales Brand Rankings - December 2014 & Year End
Subscribe to:
Posts (Atom)